Debugging with GDB
Sometimes it happens that an application compiles but still doesn't act in the way its expected. Logic errors are among the worst in programming due to how hard they're to find. For these cases, debuggers can be a really handy solution.
In this case we show the use of dgb, a console based application that can debug C/C++ language applications. Its free and open source and is widely used due to how powerful it is.
In this case we show the use of dgb, a console based application that can debug C/C++ language applications. Its free and open source and is widely used due to how powerful it is.
Running gdb
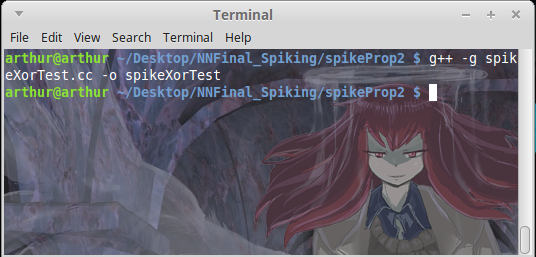
First of all its important to compile applications in a way that ensures it can be debugged. It can be done by adding the -g line to the g++ debugger so it [1].
$ g++ -g app.c -o app
$ g++ -g app.c -o app
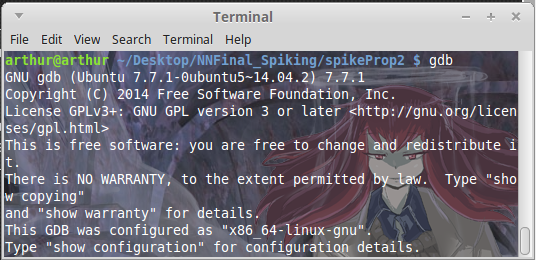
After compiling the application its now possible to execute gdb and start running tests. On the terminal type gdb and press ENTER.
$ gdb
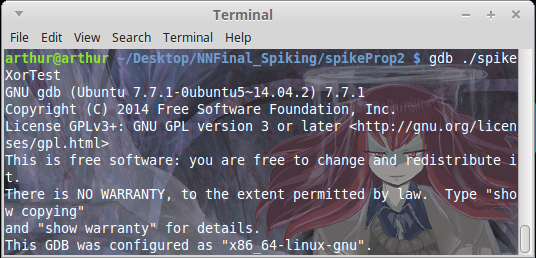
This will show the gdb application interface and allow to start debugging. One option to start debugging right away is to type gdb + ./<APPLICATION_NAME>. Its important to note that the executable must be chosen, not the code.
$ gdb ./test
$ gdb
This will show the gdb application interface and allow to start debugging. One option to start debugging right away is to type gdb + ./<APPLICATION_NAME>. Its important to note that the executable must be chosen, not the code.
$ gdb ./test
|
|
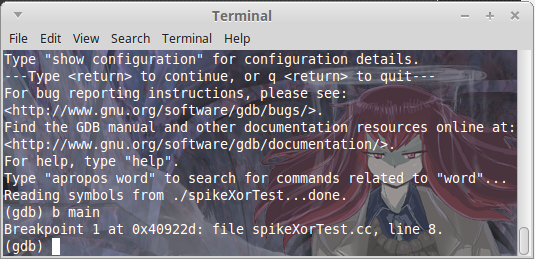
Once the application has been loaded, its necessary to start running it. Before that its useful to set a breakpoint. A breakpoint is a limit set for the debugger to stop, it won't execute any other instruction after the breakpoint until commanded to. In this case we'll set a breakpoint at the beginning of the application which is the main line using breakpoint main or b.
(gdb) breakpoint main
we can also use:
(gdb) b main
(gdb) breakpoint main
we can also use:
(gdb) b main
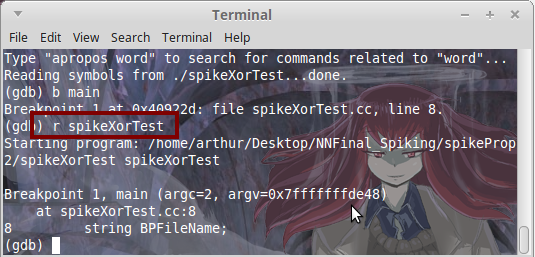
Next its necessary to run the application so that it starts executing each of the lines. In this case since there's a breakpoint set in "main" the application will load all libraries and stop at the first line of main.
(gdb) r <APPLICATION_NAME>
(gdb) r <APPLICATION_NAME>
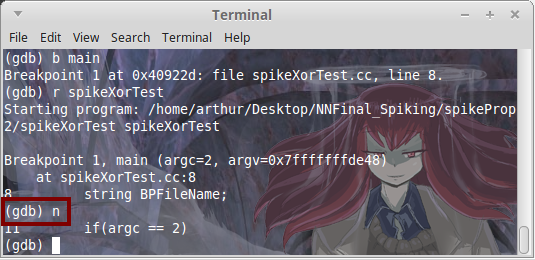
In order to move to the next line in the source code you can type the next command, which can also be compressed as n.
(gdb) next
or
(gdb) n
(gdb) next
or
(gdb) n
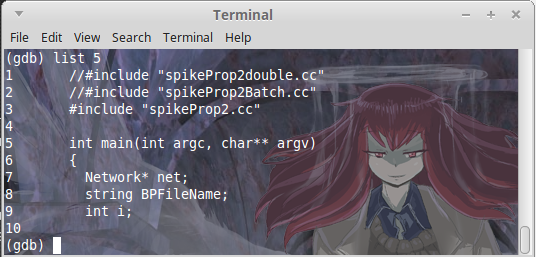
In order to print the code to see the lines and what to modify you just need to type the list command.
(gdb) list
Additionally its possible to center the command on a certain line:
(gdb) list <LINE_NUMBER>
(gdb) list
Additionally its possible to center the command on a certain line:
(gdb) list <LINE_NUMBER>
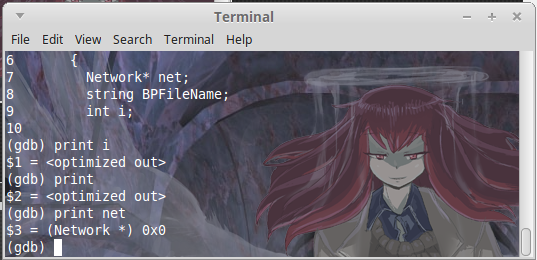
Its also possible to print the variable values using the print function.
(gdb) print <VARIABLE_NAME>
(gdb) print <VARIABLE_NAME>
Sometimes the console gets too messy, in most systems you can clear it using CTRL+L.
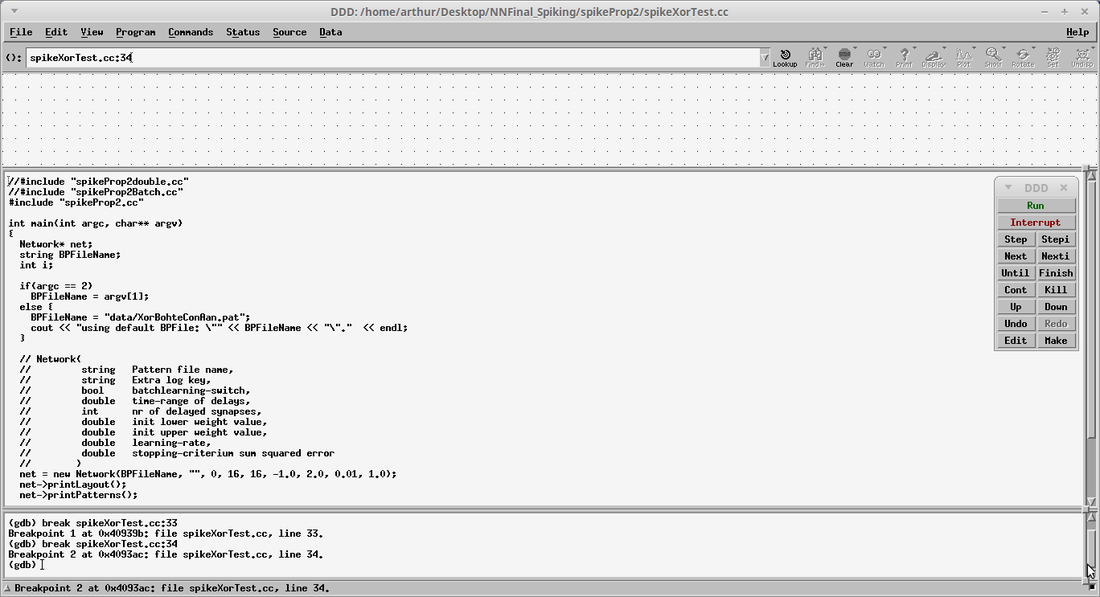
ddd or the GUI interface
As much as I hate to admit it, GUI's are here to stay and actually provide some rather nifty capabilities that can be complicated by using a Terminal alone, mainly the speed of selecting certain lines of code when you don't remember them or selecting elements to stay dynamically while another operation runs. ddd is a GUI version of gdb that allows us to debug elements using a graphic user interface.
$ sudo apt-get install ddd
$ sudo apt-get install ddd
Resources
[1] http://stackoverflow.com/questions/9245685/gdb-no-symbol-table-is-loaded
