1.-The software.

Given the project's constraints in multi-platform and a good GUI system, I chose Java as the language to design and build it. I have some experience working on it due to a course I took at college and some I looked out on my own with the RXTX library for a PLC application I made (and plan to continue in the near future).
So I designed the interface using Swing, which is Java's main application for design of GUI's. Its mostly drag and drop so the task is very fast.
So I designed the interface using Swing, which is Java's main application for design of GUI's. Its mostly drag and drop so the task is very fast.
JFreeChart.
JFreeChart is a free and open-source graph and plotting library made for the Java platform that enables users to easily and quickly plot data with a costumizable and highly visually attractive environment. In order to install JFreeChart, one must follow the next steps:
1.-Download JFreeChart from the following page:
http://sourceforge.net/projects/jfreechart/
2.-Download Netbeans programming platform, which is an IDE (Integrated Development Environment) designed to make it easy to create applications. It gives lots of useful tools like code-completion, debugging, memory allocation among others. One of its most useful properties is that it works in many famous languages (C, C++, Java, PHP, HTML, Android) which makes it ideal for beginners to use only a tool and focus on the programming process rather than having to learn to use many different environments for each language. The application must be downloaded from the Oracle site:
https://netbeans.org/downloads/
Be warned, the installation file is rather confusing, and it varies between Windows and Linux, but luckily, the applications can run in both OS's without problem.
I usually download the full version to not have problems with what language to use and sometimes to try a new language.
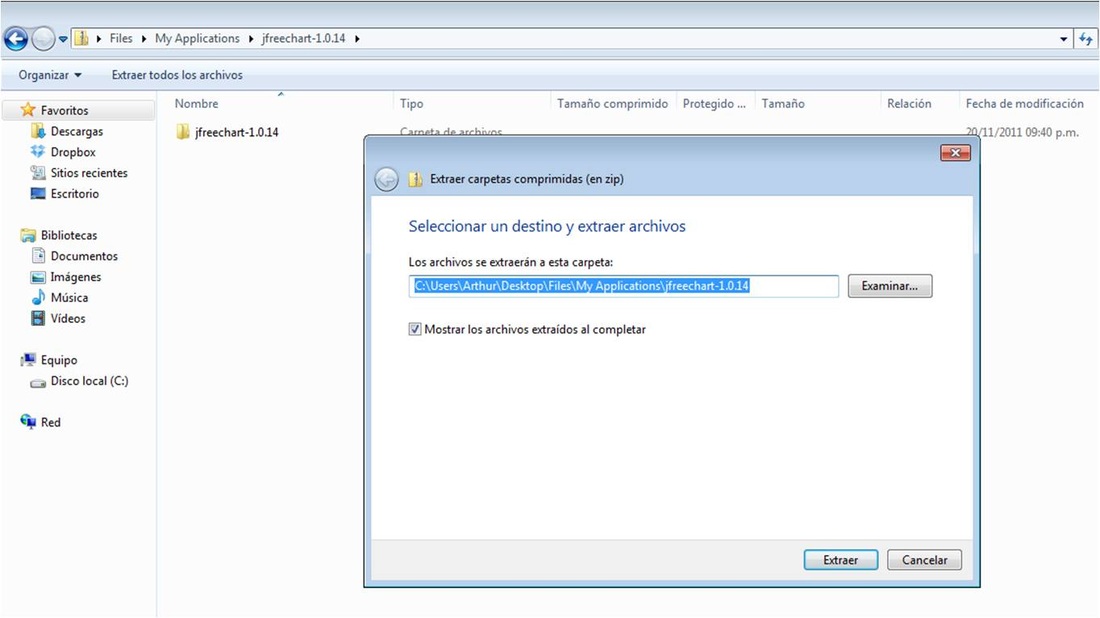
3.-We decompress the library in a directory we don't plan to delete or move, in my case I have a special folder called "My Applications" where I store all programs and applications, so I decompress it there. I repeat DO NOT MOVE or change the folder as we will reference this into NetBeans. If you make any change, the IDE may not recognize the library and it will indicate "missing reference".
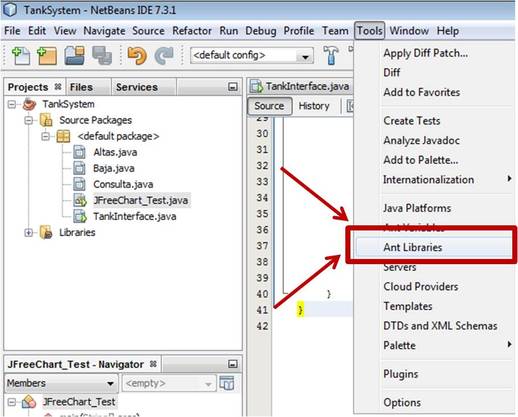
4.-Once we're done with that, we will link the library in NetBeans. To do so we go to Tools -> Ant Library menu.
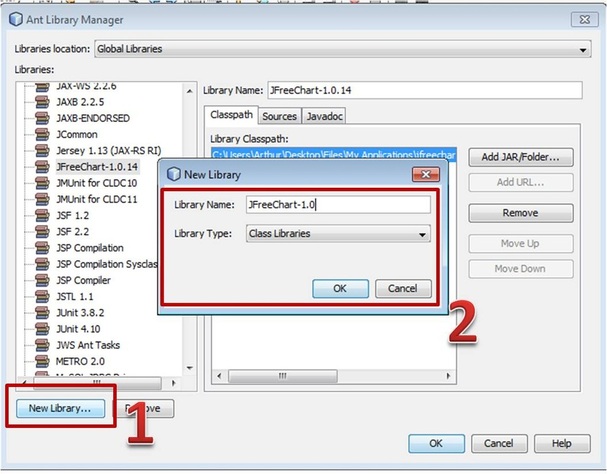
5.-Afterwards, we will get the Ant Library Menu, where we must add the library by making click in Add New Library, after which we will get another menu asking for the library name, we can give it any name, in this case I gave it the name JFreeChart-1.0.14, and we leave the type as Class Library. With that, we make click in OK.
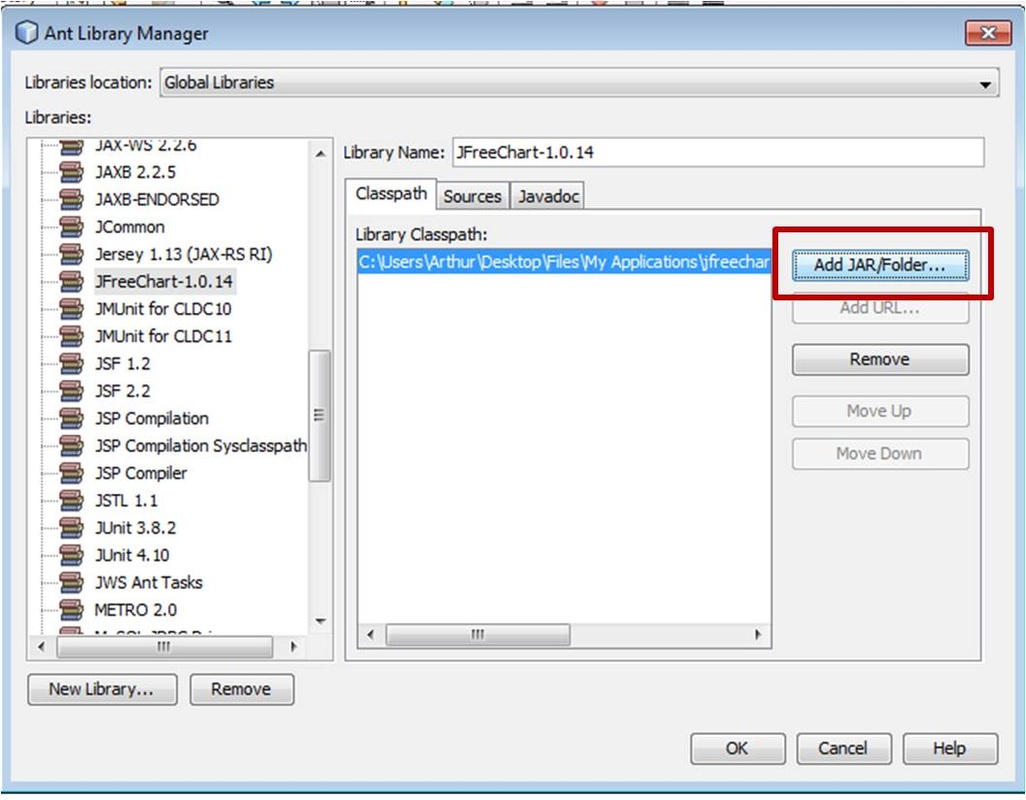
6.-Finished that, we'll be able to see the JFreeChart-1.0.14 library in the libraries list. We then must add the JAR/Folders that contain the chart libraries. We select the Add JAR/Folder button in the libraries menu making sure we have JFreeChart-1.0.14 selected.
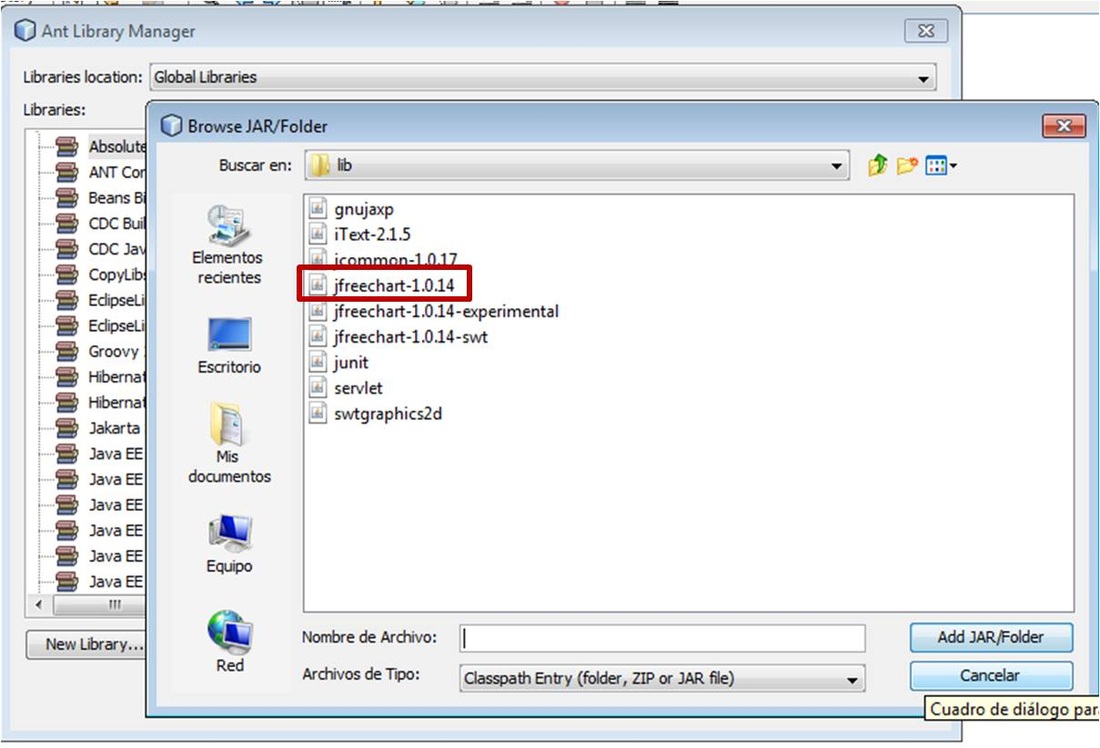
Once the menu appears, we go to the JFreeChart folder which we decompressed previously, and enter the lib folder, in my case it's in Files -> My Applications -> JFreeChart-1.0.14 -> lib -> JFreeChart-1.0.14.
We make click on it and then on Add JAR/Folder.
Once the menu appears, we go to the JFreeChart folder which we decompressed previously, and enter the lib folder, in my case it's in Files -> My Applications -> JFreeChart-1.0.14 -> lib -> JFreeChart-1.0.14.
We make click on it and then on Add JAR/Folder.
|
|
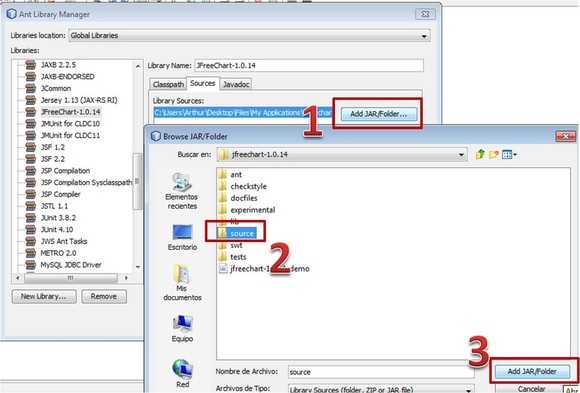
7.-Afterwards, we select the source to the libraries to which we go to the Sources label in the same JFreeChart and select the Add JAR/Folder button. We go to the location of the JFreeChart folder and select the "source" folder. Afterwards we make click in Add JAR/Folder.
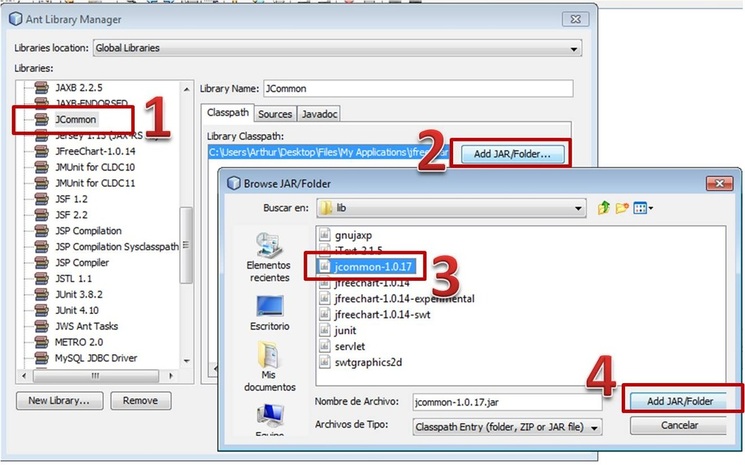
8.-We then must repeat this action with the JCommons library inside the libs folder in JFreeChart. To do so, we select the "New Library" button and name our new library JCommons. Afterwards, we select the Add JAR/Folder and seek the JCommons-1.0.17 file inside the "libs" folder. It must be located at JFreeChart-1,0.14 -> libs -> JCommons-1.0.17.
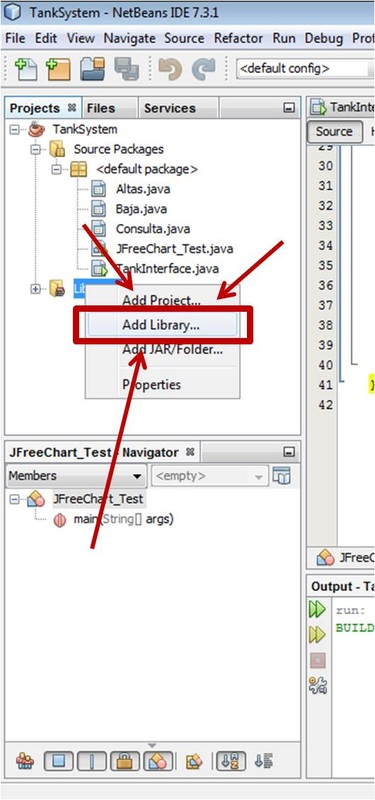
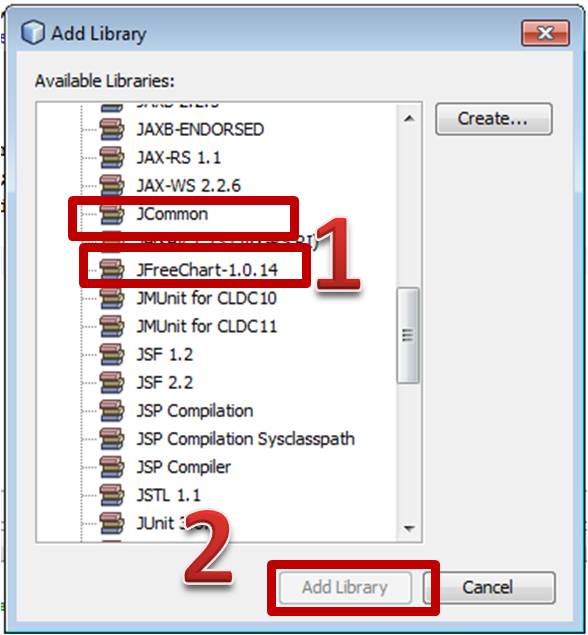
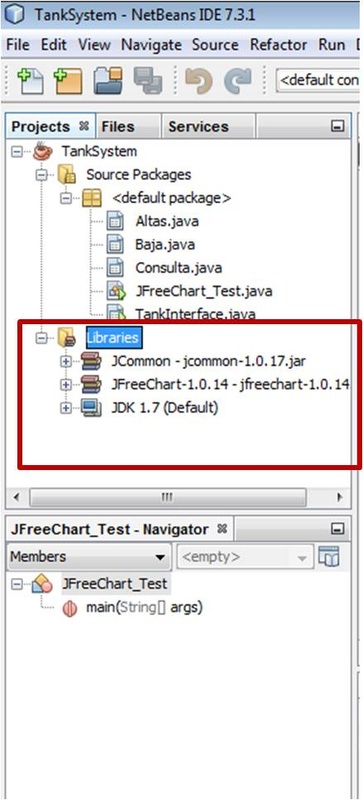
9.-We're almost there, now we need to reference the libraries we just added in our project. In every new project we make that makes use of the JFreeChart libraries we must repeat this step. We make right click in the Projects directory in the main menu of the NetBeans application and select the Libraries folder. After they have been included you should be able to see them by opening the folder.
|
|
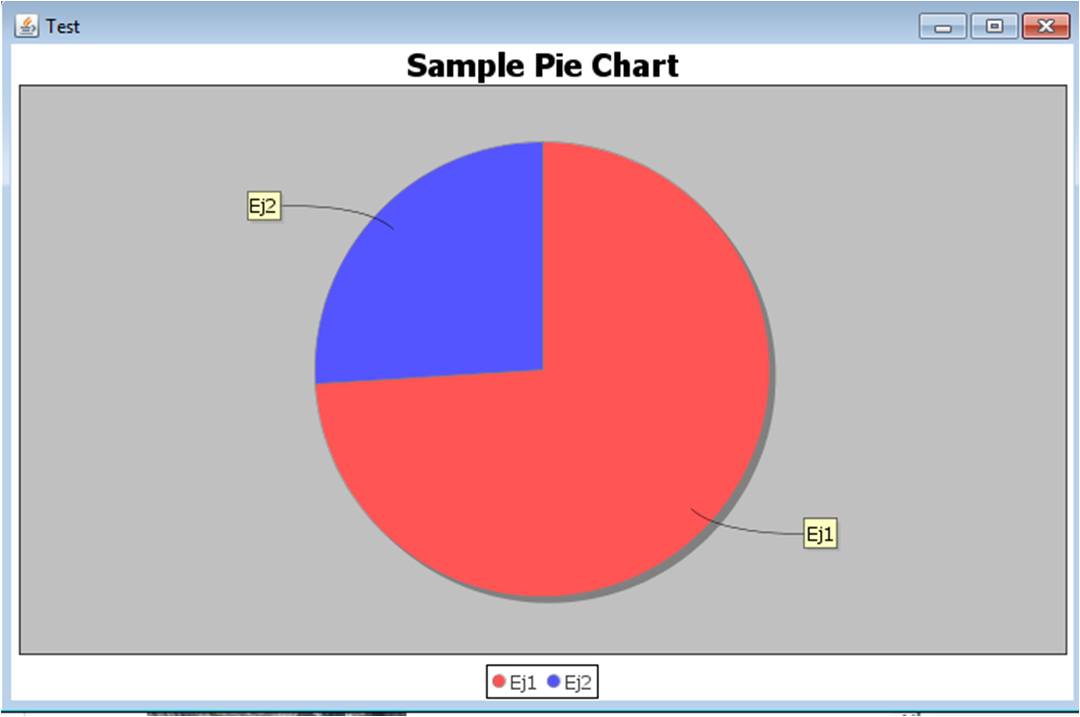
10.-Finally! At long last, now let's compile something to see if it works. Just copy and paste the following code, and it should generate a pie chart.
CODE:
/*
* To change this template, choose Tools | Templates
* and open the template in the editor.
*/
import org.jfree.chart.ChartFactory;
import org.jfree.chart.ChartFrame;
import org.jfree.chart.JFreeChart;
import org.jfree.data.general.DefaultPieDataset;
/**
*
* @author Arthur
*/
public class JFreeChart_Test {
public static void main(String[] args) {
// TODO code application logic here
// Creamos el DataSet
DefaultPieDataset dataset = new DefaultPieDataset();
// Establecemos unas categorías de ejemplo
dataset.setValue("Ej1",43.2);
dataset.setValue("Ej2",27.9);
dataset.setValue("Ej1",79.5);
// Creamos la tabla
JFreeChart chart = ChartFactory.createPieChart(
"Sample Pie Chart",
dataset,
true,
true,
false
);
// Mostramos la tabla
ChartFrame frame = new ChartFrame("Test",chart);
frame.pack();
frame.setVisible(true);
}
}